System Diagnostics
The System Diagnostics widget shows what Mnemosyne OS costs your machine, live: processor, memory, GPUs, every model held in RAM, and every byte that crosses the network. The readings below come from a real working session with an image-library indexing running in the background. Your numbers will differ.
The vitals
CPU, memory, and a live four-curve graph: processor, RAM, GPU and VRAM over the last minutes.
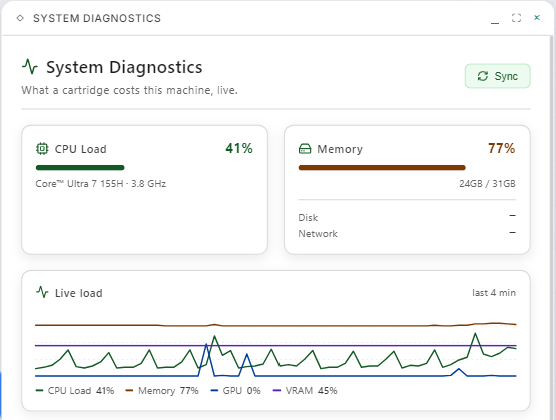
In this reading the OS is indexing a whole image library, and the machine sits at 41% CPU.
The GPU, respected
Both GPUs are watched: load, VRAM, temperature.
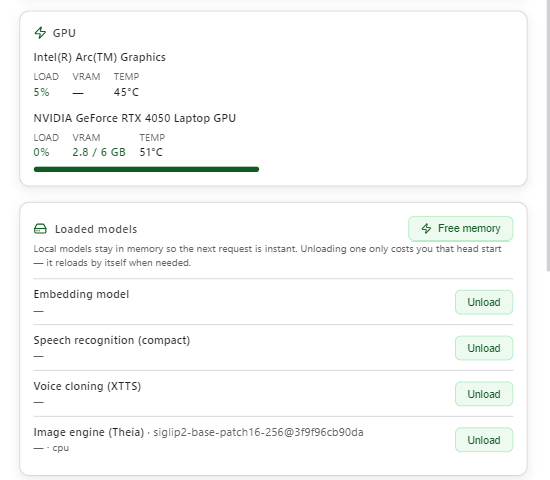
Look at the NVIDIA line during that same indexing run: 0% load, 51°C, 2.8 GB of VRAM parked. Background work leaves your graphics card alone, so you can game, edit video or work while the OS indexes. That's a design decision, explained in the next section.
Loaded models, and the CPU trick
Every engine currently held in memory is listed, each with its own Unload button. Local models stay in memory so the next request is instant, and unloading one costs you that head start and nothing else: it reloads by itself when needed.
The line that explains the quiet GPU: the Theia image engine,
siglip2-base-patch16-256, a 400-million-parameter vision-language encoder,
runs marked cpu. Image indexing goes to your processor's cores on
purpose. It takes longer, and in exchange it leaves your VRAM free, runs on
an ordinary machine, and never asks you for a professional graphics card.
Semantic image search on regular hardware.
Settings gains a row that installs the CUDA runtime and moves the image engine onto your NVIDIA card, and the panel offers the move by itself when a large batch of images is waiting. Nothing is marked as upgraded until the app has proven CUDA actually works, so a failed install leaves you exactly where you were.
cpu stays the default, and it is what this page describes.
Mnemosyne OS on the wire
The counter that settles the sovereignty question:
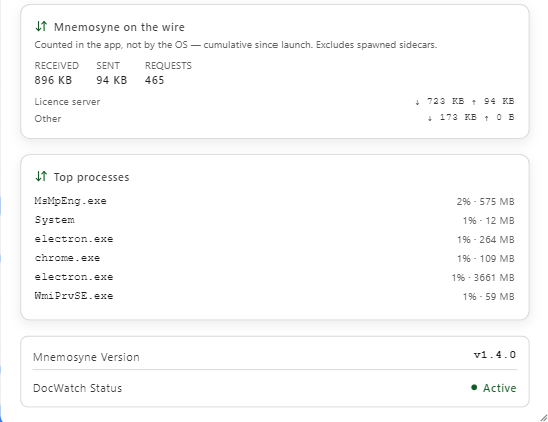
Counted in the app, not by the OS, cumulative since launch. This session: 896 KB received, 94 KB sent, 465 requests, almost all of it the licence server. Meanwhile the OS indexed an entire image library. Your files, your chronicles, your indices stay home. The heavy lifting of your neural map happens entirely on your machine.
Disk space
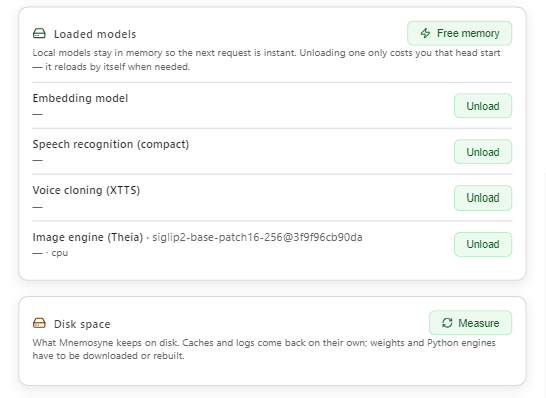
What Mnemosyne OS keeps on disk, measurable on demand, with a taxonomy: caches and logs come back on their own, while model weights and Python engines have to be re-downloaded or rebuilt.
Read from across the board
A panel built for someone sitting in front of it does not survive being zoomed away from: at 22% those 10px labels paint under 3px, which is the worst of both worlds. So below about 70% zoom the widget stops being a readout and becomes a sign: three numbers big enough to read from where you are, how many engines hold memory, and a row of glyphs saying which ones.
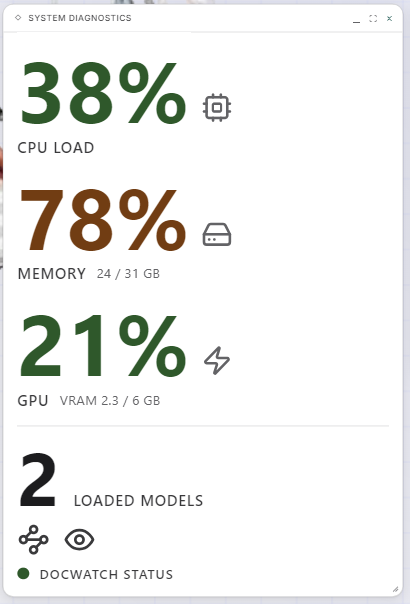
Same sample as the detailed panel, and the same rule about what it may claim: a
counter this machine cannot report shows — here exactly as it does up close,
and the model row shows — until a runtime list has actually come back. At this
size a 0 would be the most confident looking lie on the screen. Zoom back past
78% and the full panel returns.
Each glyph is also an unload, and one click from across the board is easy to land by accident, so it asks first:
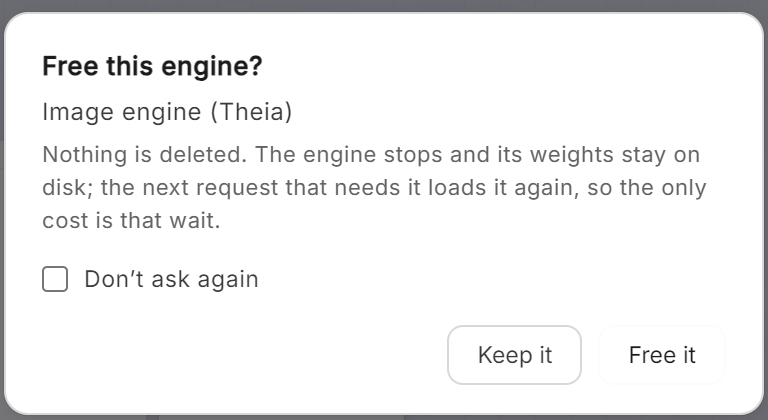
The buttons say Keep it and Free it rather than Cancel and OK, and the dialog names the cost instead of asking whether you are sure:
Nothing is deleted. The engine stops and its weights stay on disk; the next request that needs it loads it again, so the only cost is that wait.
Don't ask again is written only when you confirm. Ticking the box and then keeping the engine means "not this one", so the question stays armed for the next click.
No rented cloud servers, no high-end rig required, and the counters that say so are on your screen.